🌤️ Weather
The Weather layer is useful for displaying live weather information on your screens. It reads current conditions or a multi-day forecast from the external OpenWeatherMap API, and can rotate through several cities within the same layer, with full control over units, language, refresh timing, and the icon set used for the weather symbols.
Voome provides its own API key, so the layer works as soon as you add it to a project. You only need an OpenWeatherMap account if you prefer to use your own subscription.
The device reads the forecast from the OpenWeatherMap API and keeps a copy of it, so the layer keeps showing the last reading through a network outage. A connection is needed to refresh it.
Create a project
- Open the Project section and create a new project that fits the target screen.
- Click Add new layer.
- Search for the Weather layer and add it.

Weather mode
There are two different mode to display the Weather on the screen: Current and Daily forecast. The Forecast Mode field decides what the layer asks the API for. It is the first choice to make, because it changes which of the other settings have an effect and which information the layer can put on screen.
Current
current returns a single reading per city: the conditions measured at that moment. This is the default.
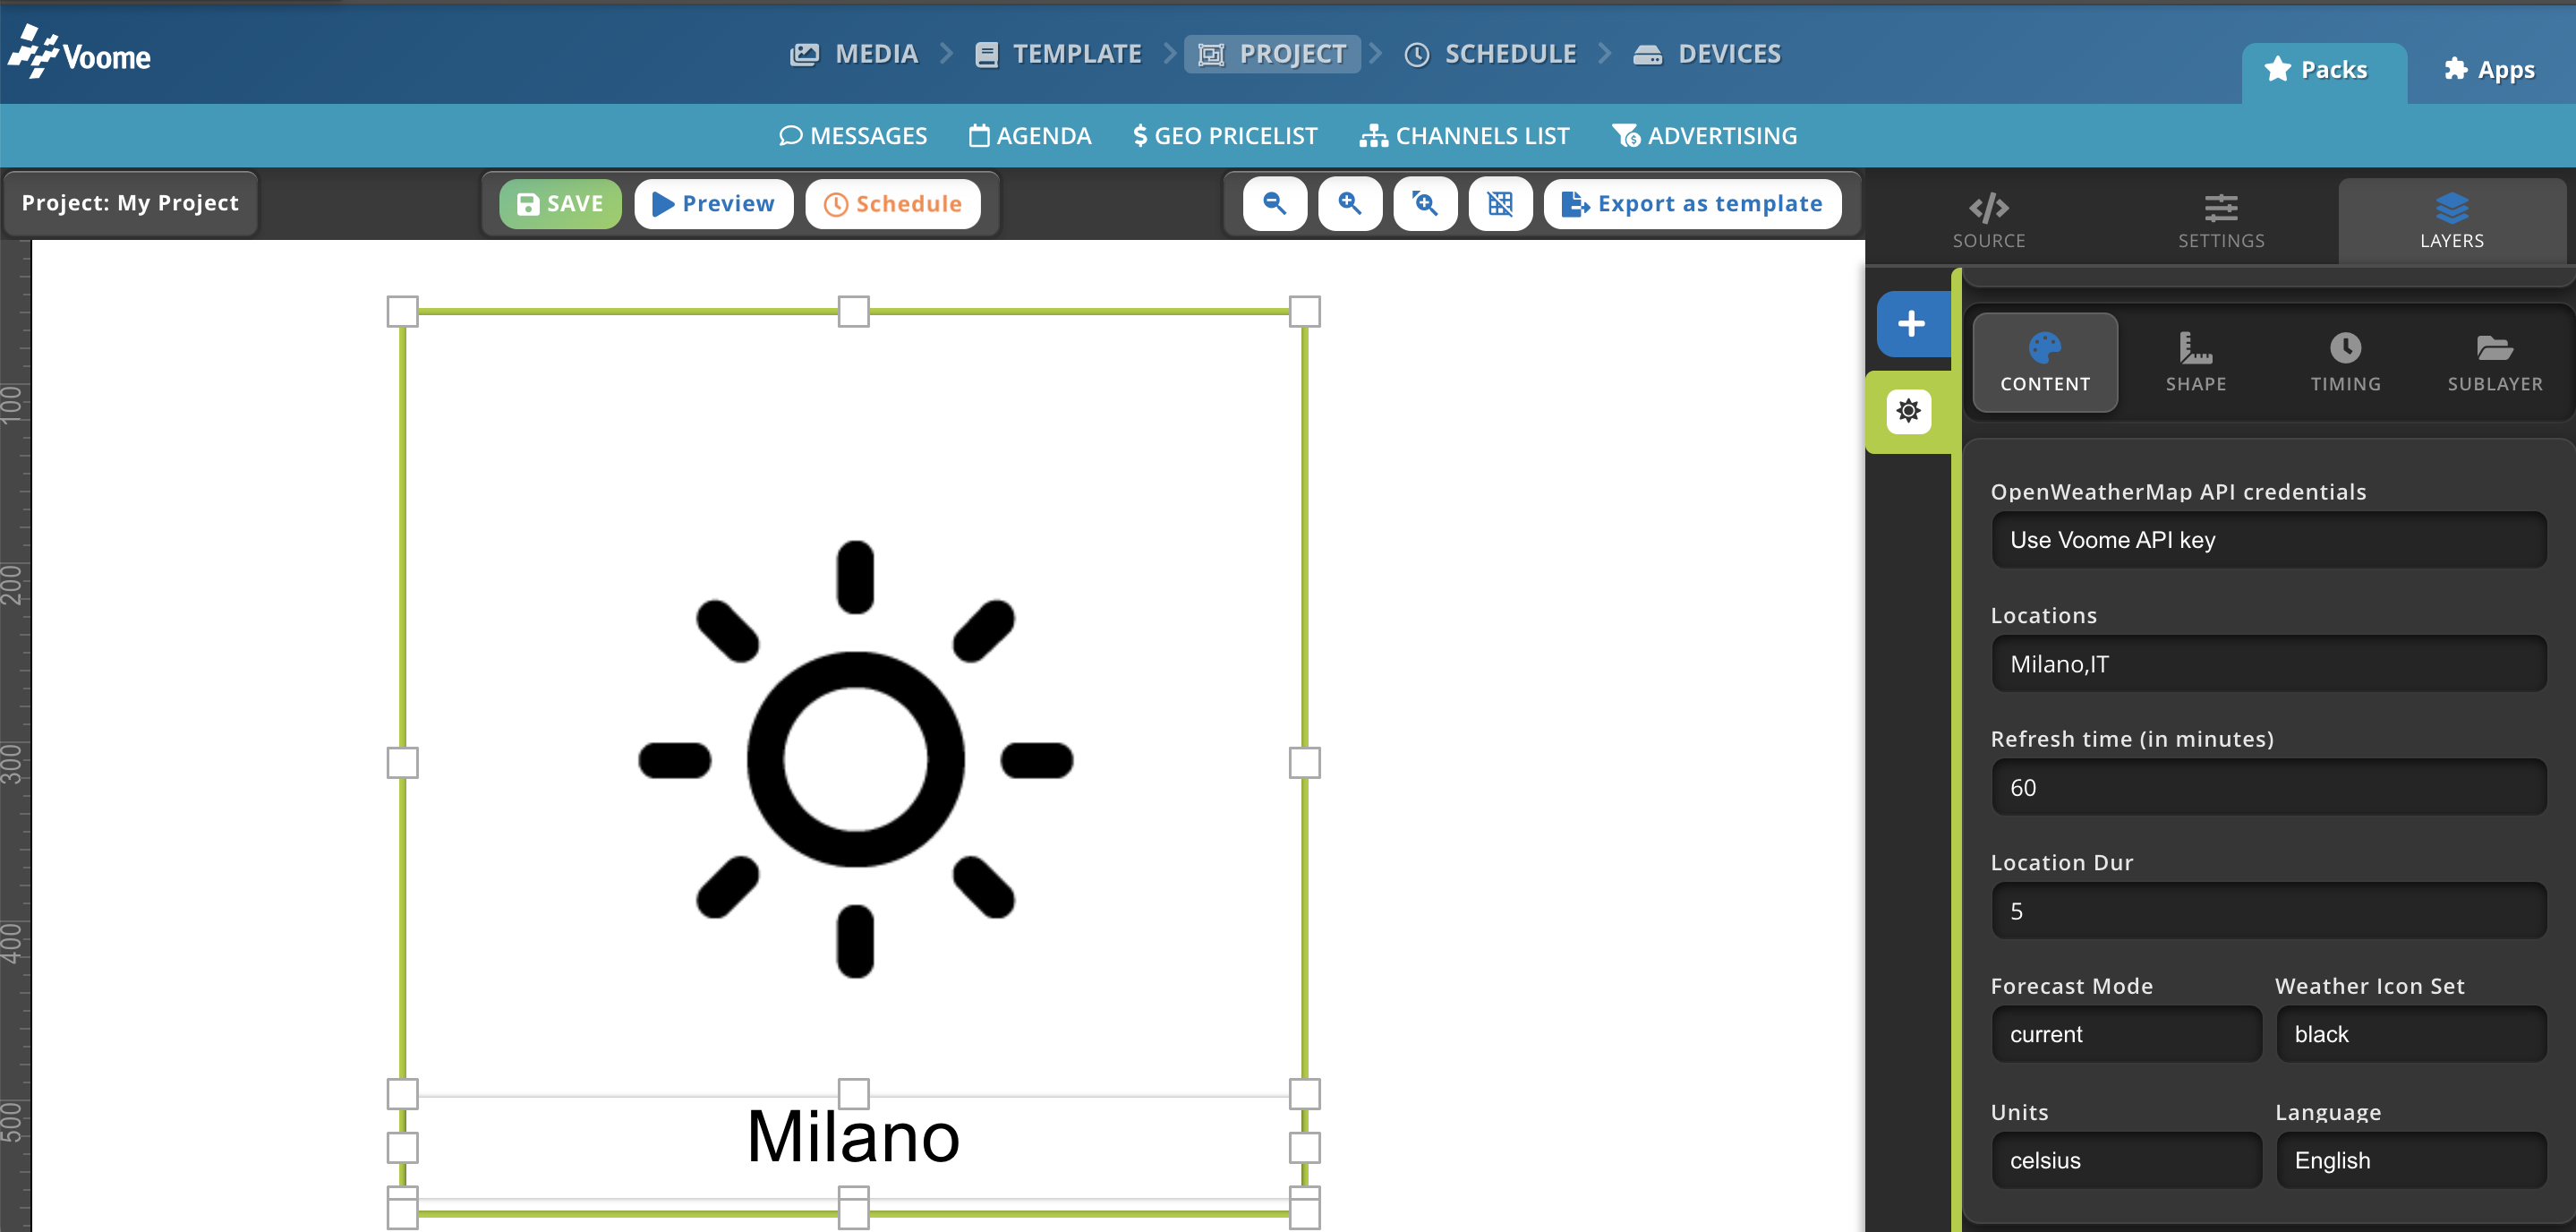
Each city provides one temperature value, its weather condition, and the matching icon. Results Count has no effect here, since there is nothing to look ahead to. With several cities in Locations, either let them rotate one at a time using Location Dur, or show them side by side in a Rows x Columns grid.
Use it for a compact "right now" block, for example a city name, an icon, and one temperature in a corner of the screen.
Daily forecast
Daily forecast returns one reading per day, for as many days ahead as you set in Results Count (from 1 to 7).
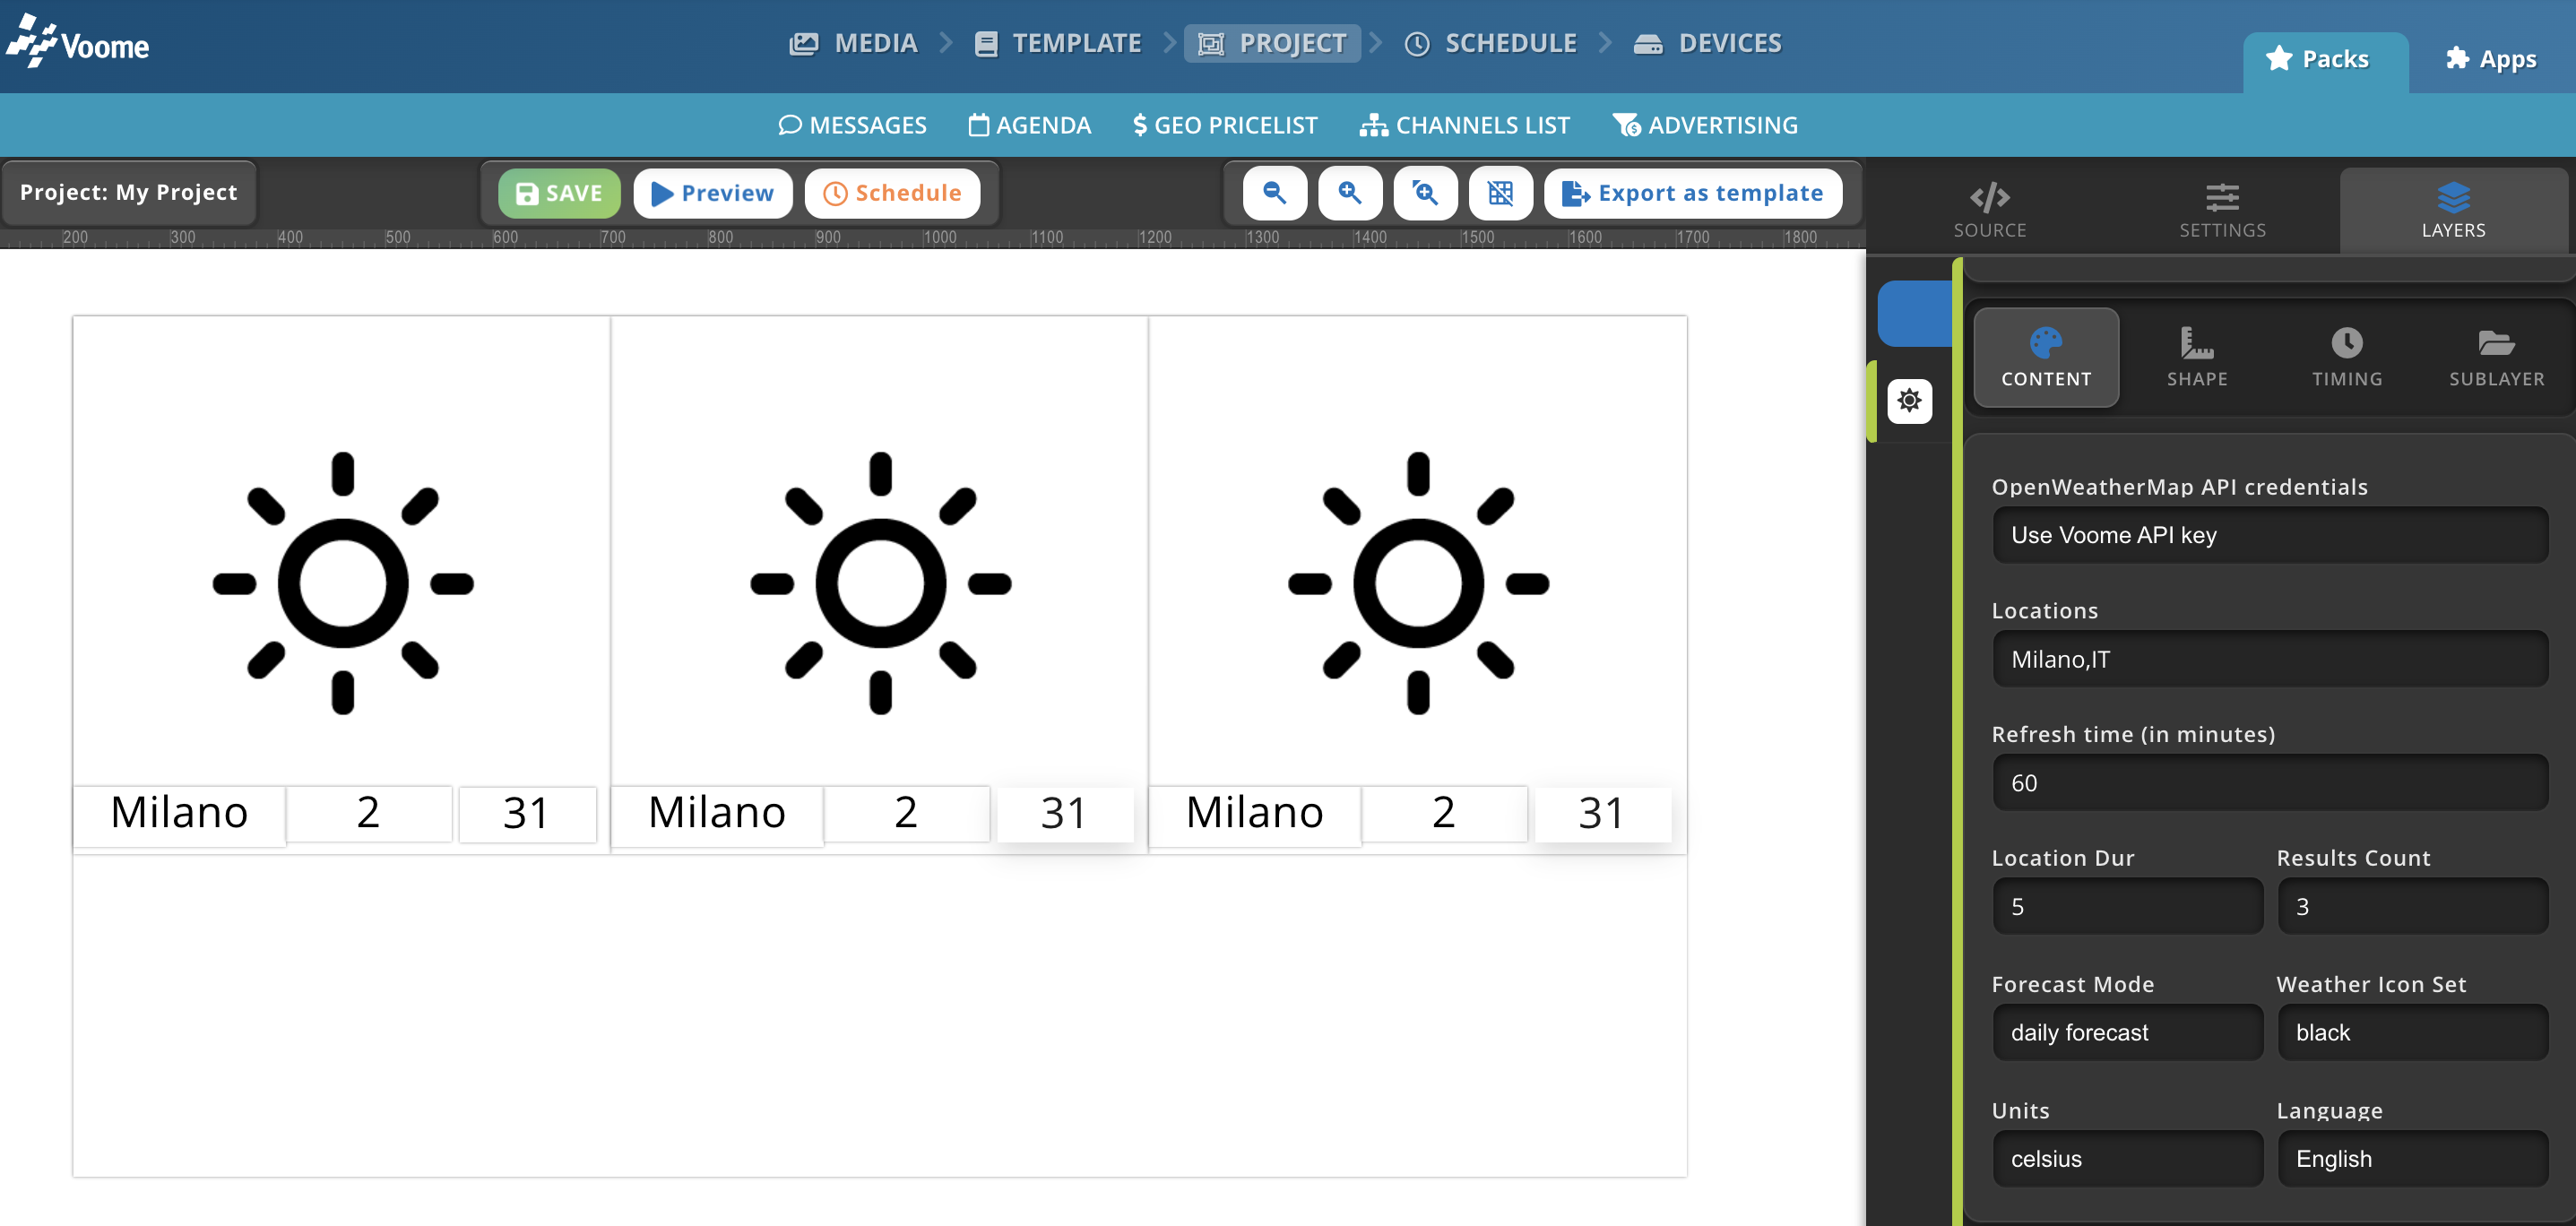
A forecast day carries more information than a current reading: instead of a single temperature you get a minimum and a maximum, plus the day of the week, the humidity, and the probability of precipitation. Because there are several days to display, this mode is where the Rows x Columns grid matters most: a 1 row by 3 columns grid with Results Count set to 3 gives a three-day strip on one page.
Use it when the audience needs to plan ahead, for example a week view in a lobby or a staff area.
Switching Forecast Mode changes the list of fields you can add as sublayers. Choose the mode first, then design the layer around it.
Content fields
- OpenWeatherMap API credentials: the key used to call the API. Leave it on Use Voome API key to use the key provided by the platform. If you have your own OpenWeatherMap subscription, add the key under Third Party Credentials and then select it here.
- Locations: the cities to show, each written as
City,CountryCode. To show more than one city, separate them with a semicolon (e.g.Milano,IT;Paris,FR;London,GB). The layer then rotates through them one city at a time, or shows them together in a Rows x Columns grid. - Refresh time (in minutes): how often the device fetches fresh data from the API (default 60 minutes). Weather conditions do not change by the second, so a high value is usually enough and keeps the number of API calls low.
- Location Dur: how many seconds a city stays on screen before the next one is shown. It only matters when Locations contains more than one city.
- Results Count: how many days ahead to retrieve, from 1 to 7. It applies to the
daily forecastmode only, and is ignored incurrentmode. - Forecast Mode: what kind of data to display,
currentordaily forecast. See Weather mode above. - Weather Icon Set: the images used for the weather symbol.
blackandwhiteare the built-in sets, so pick the one that contrasts with your background.open_weather_mapuses OpenWeatherMap's own colored icons. Any custom set loaded for your account also appears in this list. How to create custom icon set - Units: the unit used for temperatures.
- celsius (default)
- fahrenheit
- kelvin
- Language: the language the API answers in. It affects the text coming from the service, such as the description of the condition (
clear skyin English,cielo serenoin Italian). It does not affect any label you write yourself in the project.
Layout fields
The Weather layer arranges its results in a table, so you can show several days at once instead of one at a time.
- Rows and Columns: the grid of results drawn on one page. For example,
daily forecastwith Results Count set to 5 and a 1 row by 5 columns table produces a five-day strip. - Row Padding, Col Padding and Cell Padding: the spacing around and inside the cells of that grid.
Sublayers
The Weather layer does not draw the data by itself. Move to the sublayer section and add a sublayer for each piece of information you want on screen. Sublayers can be edited and moved like regular layers, but they remain tied to their parent Weather layer.
The available fields depend on the selected Forecast Mode:
| Field | current | daily forecast |
|---|---|---|
| City | ✅ | ✅ |
| Icon | ✅ | ✅ |
| Temperature | ✅ | |
| Min Temperature | ✅ | |
| Max Temperature | ✅ | |
| Day of Week | ✅ | |
| Humidity % | ✅ | |
| Probability of precipitation | ✅ |
If you change Forecast Mode after building your sublayers, check that each one still refers to a field that exists in the new mode.
🙋🏼 Common Issues
Nothing appears for one of my cities
The city name is sent to OpenWeatherMap as written, so a typo or a missing country code returns no data for that location, while the other cities in the list keep working.
Check that the entry follows the City,CountryCode format, that the code is the two-letter ISO country code (IT, FR, GB), and that there is no stray semicolon at the end of the field. If a local spelling is not recognized, try the English name of the city.
The screen still shows the old forecast
The device keeps the data it downloaded until Refresh time has elapsed, so a change made in the project is not necessarily visible straight away. Publish the project again to force the device to load the new configuration.